A/B Testing
A/B Testing
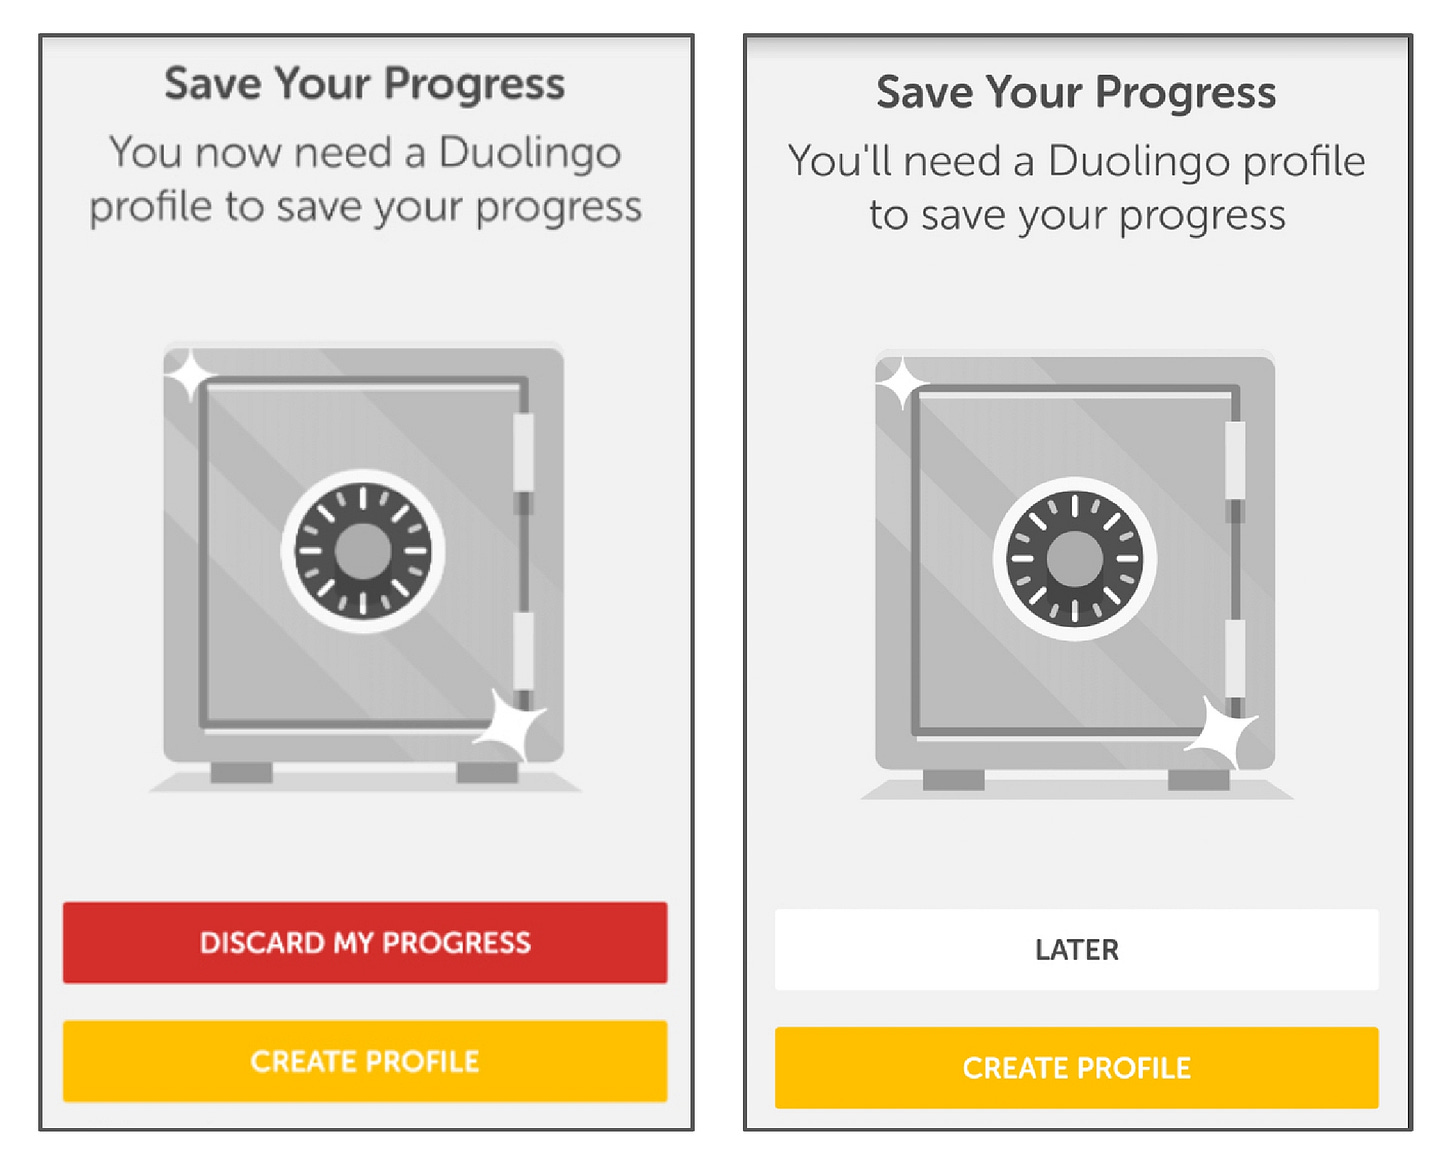
A/B testing, or 'split-testing', is a method of testing variations of components on web pages, app interfaces, ads, or emails. You start with a goal (say, earning more sign-ups) and test two versions with similar audiences. If there's a clear winner, you adopt that version.
 Benefits of A/B testing:
- Optimise performance
- Reveal hidden trends and user behaviours
- Incorporate user feedback without disrupting user experience
- E-commerce site — increase purchases
- Consumer app — increase time spent in-app
- Online publication — increase sign-up conversion rates
- Business app — increase revenue-per-user
- Step 1: Define your goal
- Step 2: Look at your current data
- Step 3: Come up with a hypothesis
- Step 4: Perform A/B test and analyse the results
- Step 5: Repeat with something else
Cohort Analysis
Cohort Analysis
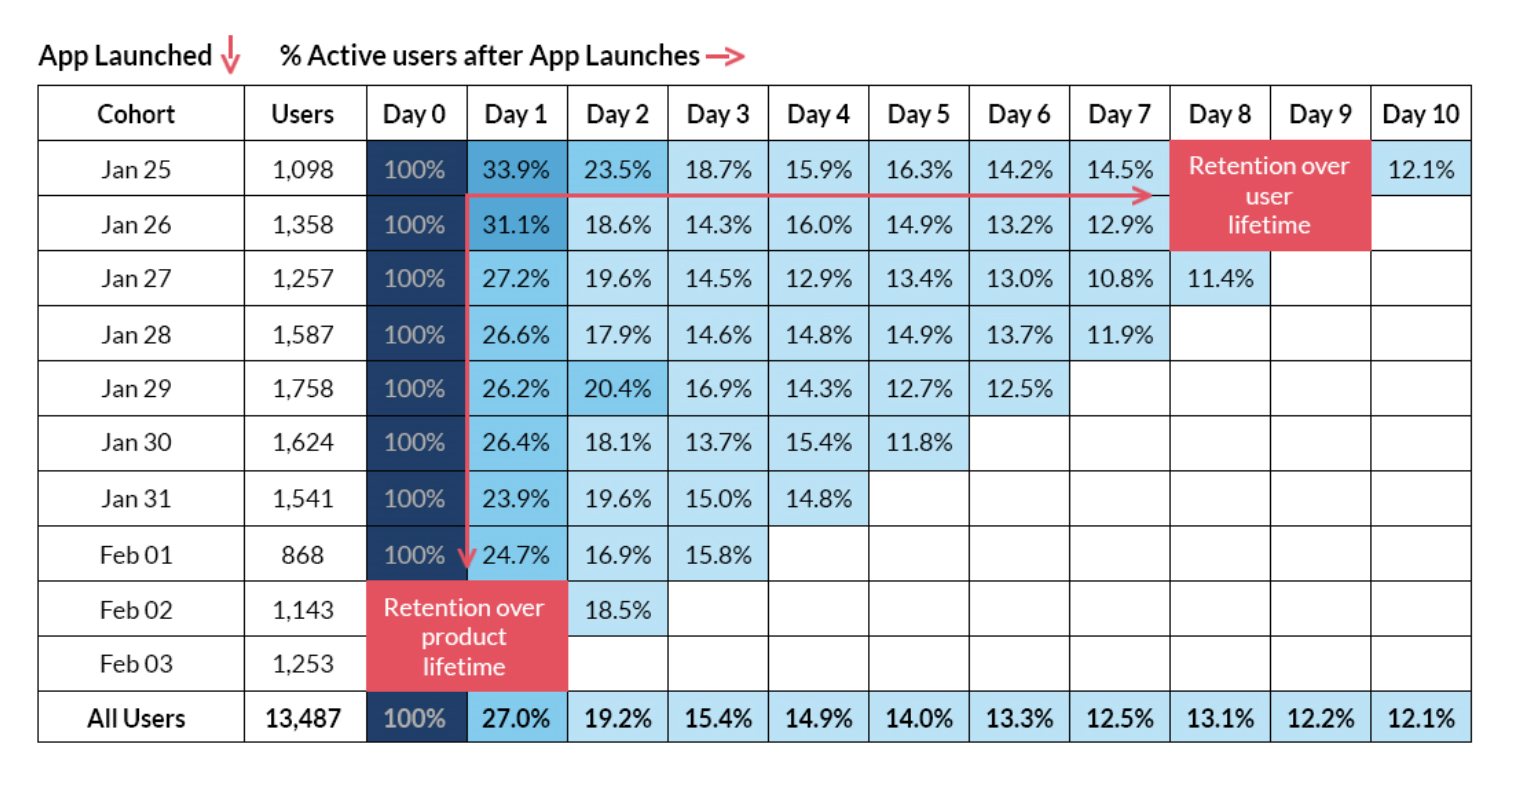
Cohort analysis is a type of behavioural analytics where you take a group of users and analyse their usage patterns based on shared traits to better track and understand their actions. A cohort is simply a group of people with shared characteristics.
The two most common types of cohorts:
- Acquisition cohorts — groups divided based on when they signed up. Useful for measuring retention and churn rates within a specific timeframe.
- Behavioural cohorts — groups divided based on their behaviours and actions in your product. Lets you view active users across different demographics and behavioural patterns.
Calm wanted to test their reminder feature. They noticed a small set of highly engaged users actively used it, but the feature was buried in settings. They ran a test where select users got a prompt to set a reminder after their first meditation session.
Using behavioural cohort analysis comparing those who set a reminder with all active users, Calm found that using the reminder feature increased engagement across the board — not just for the already-engaged users.
Events Design
Events Design
Imagine you're a user of an app and you go through this flow: open the app → home page → click Pay Now → complete payment. Event analytics means that for each of these actions, a data point is stored in your analytics software. These actions are stored as "events".
Storing this data helps product managers look at how users are using the product in the form of data.
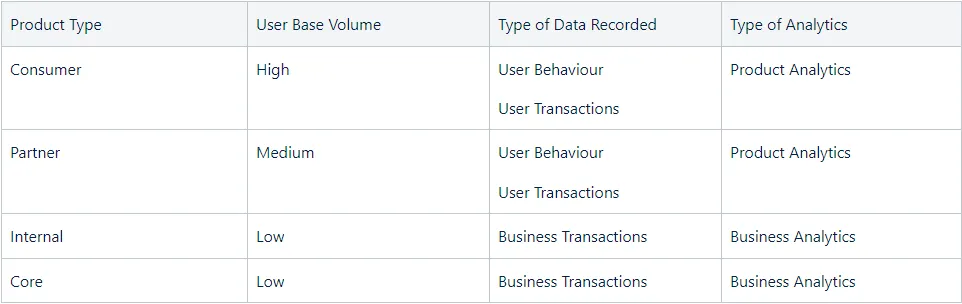
What type of products use event analytics?- Consumer Products — social media, fintech, e-commerce, food delivery. Common use cases: signup funnel efficacy, order funnel efficacy, user engagement and retention trends, cohort insights.
- Partner Products — marketplace delivery, lead sourcing platforms. Use cases: key action funnel efficacy, order and user cohort insights.
- Internal Products — operations-focused products with on-ground teams. Product analytics isn't usually required since user flow is already decided and user base is low.
- Core Products — inventory management, order management, pricing management systems. Analytics usually not required due to low volume and strict workflows.
Funnel Analysis
Funnel Analysis
Funnel analysis is a method used to analyse the sequence of events leading up to a point of conversion. It lets product and marketing managers understand user behaviours and obstacles throughout the customer journey.
Example funnel — converting free trial to paid subscribers:- Step 1: Prospects open an email and discover an offer for a free trial.
- Step 2: They click on a CTA button to redeem the free trial.
- Step 3: Prospects create an account and use the product for free.
- Step 4: Prospects convert to paid customers after the free trial expires.
- Emails sent: 1,000
- Emails opened: 300 (30%)
- CTA clicked: 150 (50% of opened)
- Free account created: 100 (67% of clicked)
- Paid conversion: 20 (20% of accounts)
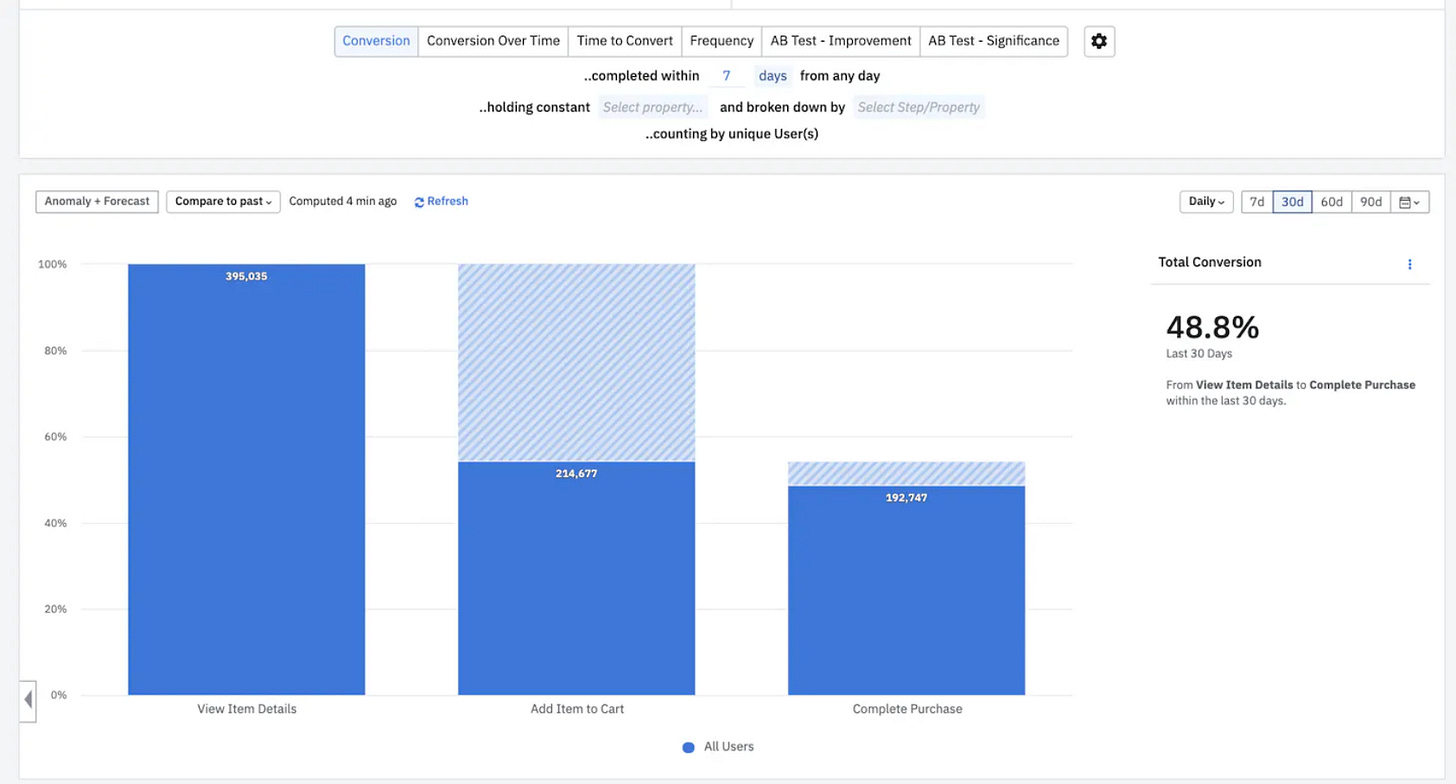
Seeing conversion as a funnel tells you which step has the biggest drop-offs so you can investigate root causes. Funnel analysis is a big part of any RCA process.
Case study — Patreon: Patreon discovered an opportunity to improve their pledge flow funnel through funnel analysis. They tested "blurred posts" to encourage more users to click through the pledge flow. Result: Patreon doubled pledge conversions on creator pages.Hypothesis Testing
Hypothesis Testing
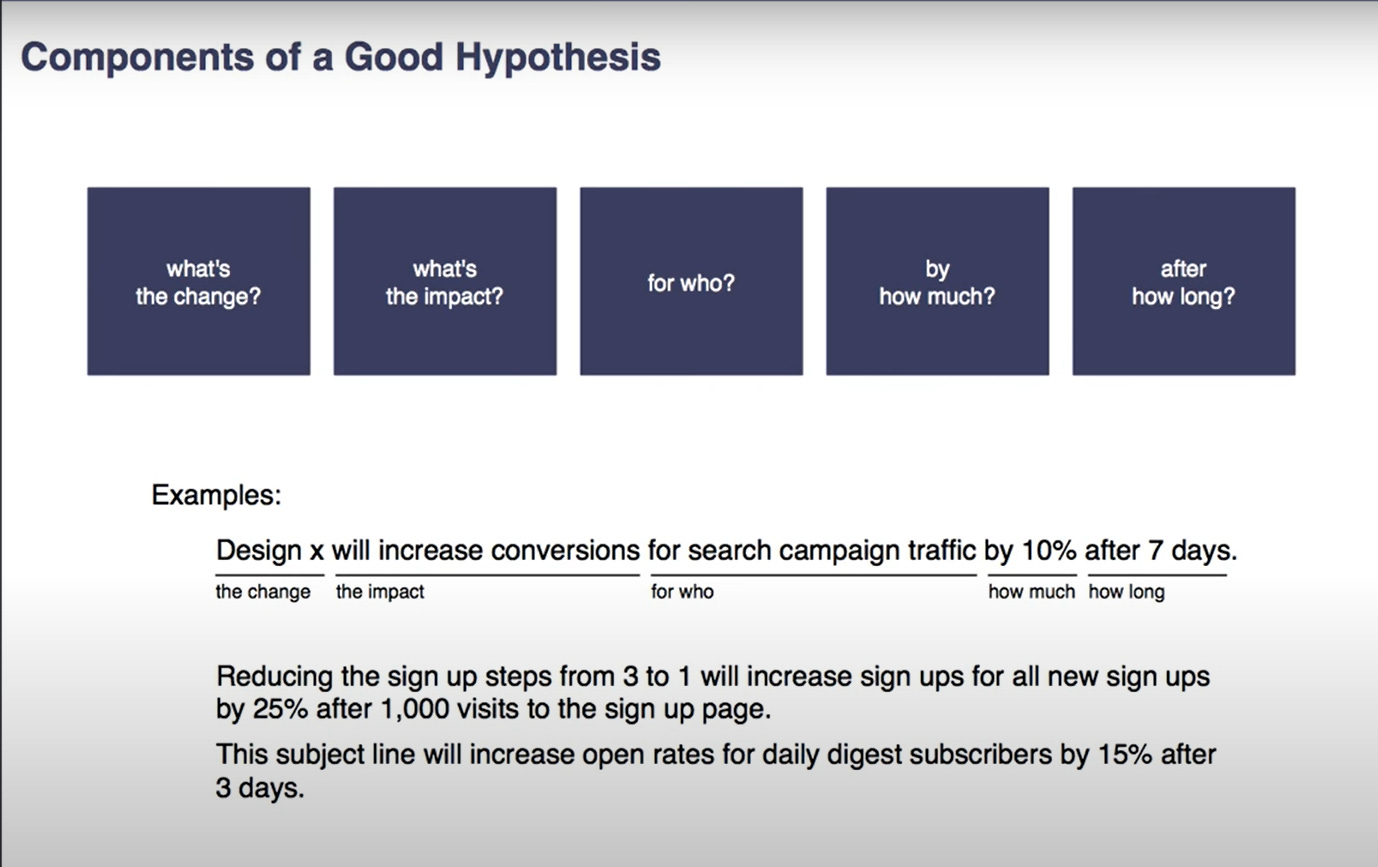
A product hypothesis is an assumption made within a limited understanding of a specific product-related situation. It needs validation to determine if it will actually deliver the predicted results.
The three crucial factors of a hypothesis:- Assumption — based on observations, either to fix a problem or update a feature.
- Condition — the reason the assumption was made (e.g. lack of user interaction, dip in traffic).
- Prediction (Impact) — the success or failure rate of the hypothesis.
Example: "Increasing the size of images will give us 10% more clicks on the images after 1 week."
 How to do Hypothesis Testing:
- Step 1 — write down the uncertainties and challenges. Brainstorm questions.
- Step 2 — build hypothesis statements. A problem can have multiple solutions.
- Step 3 — test your hypothesis. Determines whether to accept and ship or reject and iterate.
Metrics You Should Know
Metrics You Should Know
There are 3 types of metrics:
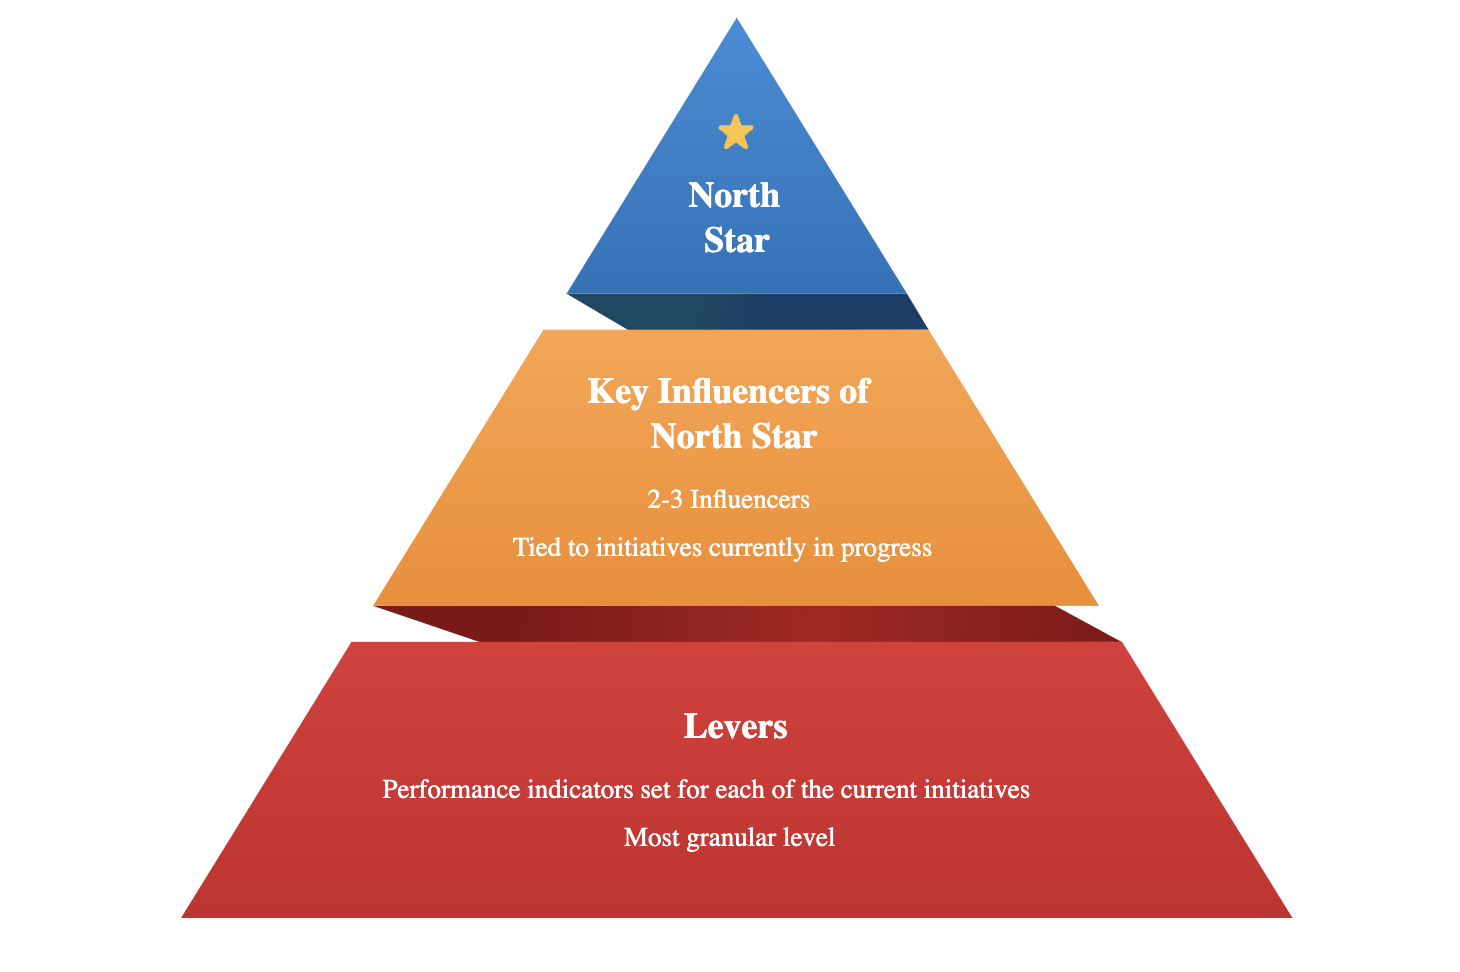
- The North Star Metric — the key measure of success for the product team. It defines the relationship between customer problems and the revenue the business aims to generate. It gives clarity and alignment on what to optimise for, communicates the product organisation's impact to the rest of the company, and holds product accountable to an outcome. To qualify, a metric must lead to revenue, reflect customer value, and measure progress. Example: Instagram → Monthly Active Users; Spotify → Total time spent listening.
- Primary Metrics / L1 Metrics — depict the desired outcome of a particular product, team, or initiative (unlike the NSM which represents the company as a whole). They should either directly contribute to the NSM or act as a check to ensure healthy growth.
- Supporting Metrics / L2 Metrics — leading indicators that tell you how your NSM will change before it actually changes. Also tell you where efforts to move your NSM may be falling short.
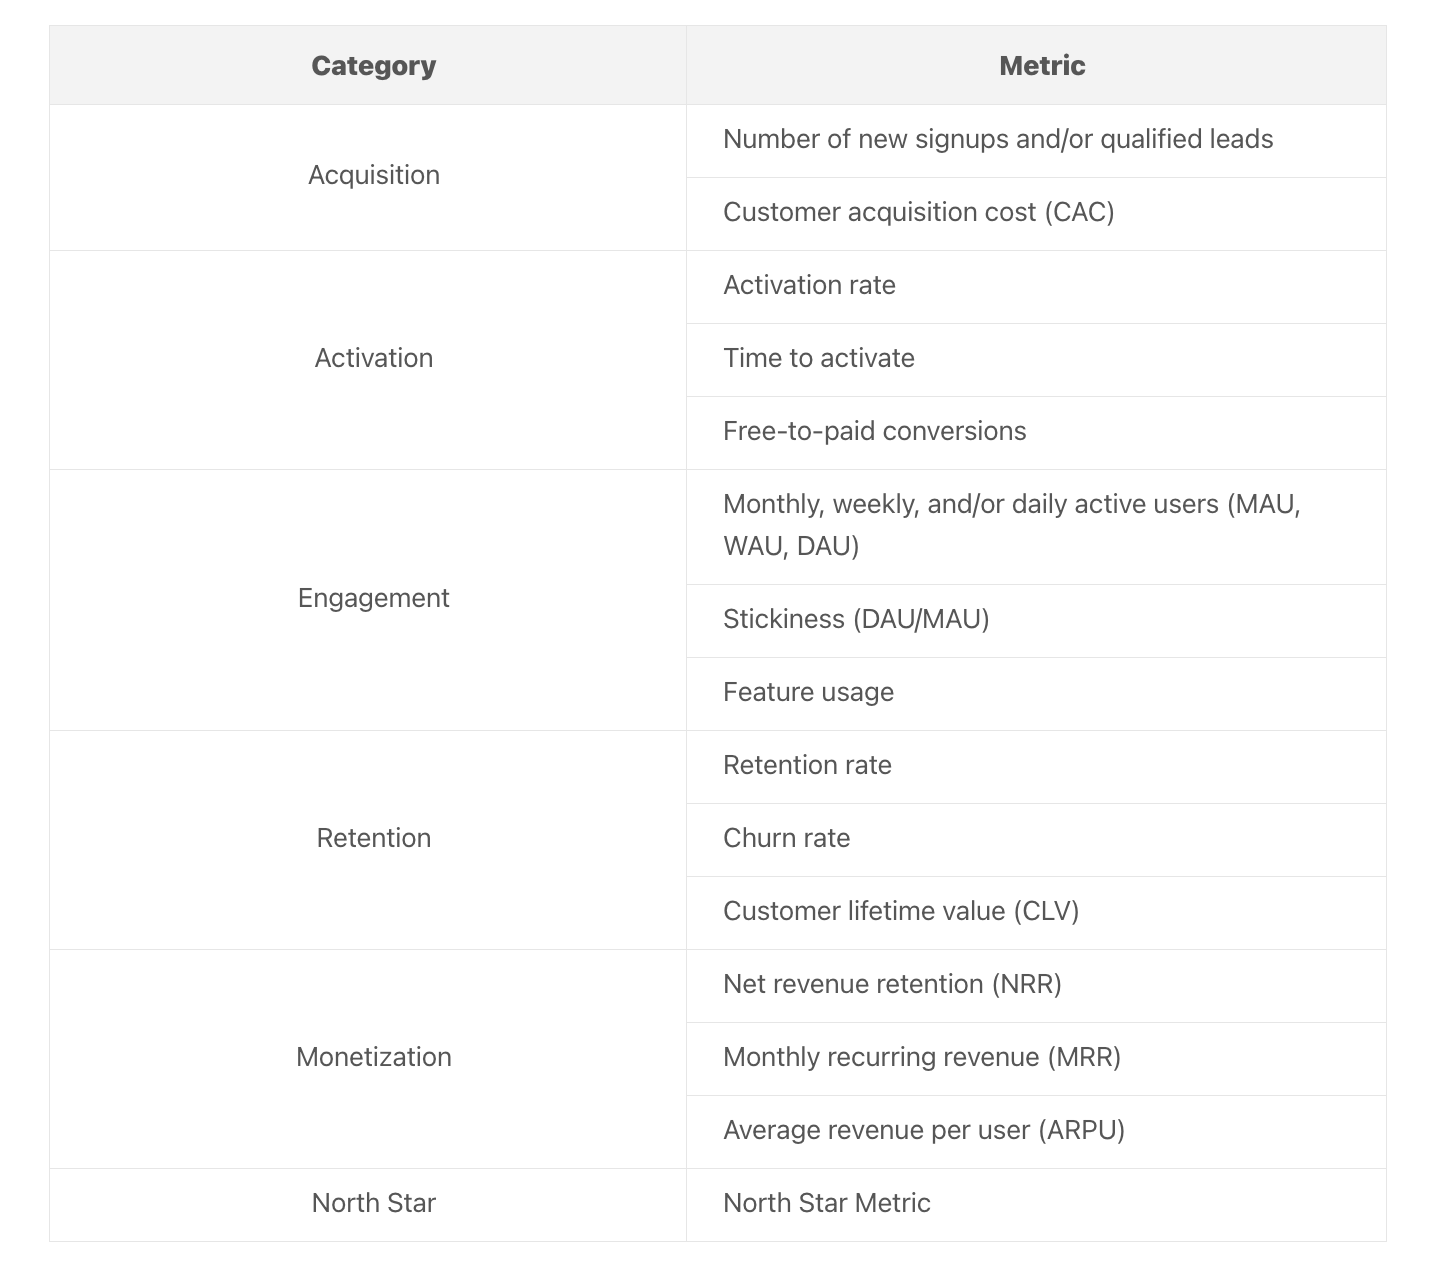
Key Metric Categories
- Awareness — website visits, social media metrics, time on site, email open rate.
- Acquisition — number of leads, qualified leads, sign-ups, downloads, installs.
- Activation — number of connections made, times an action is performed, steps completed.
- Engagement — DAU/WAU/MAU, time per session, session frequency, in-product actions.
- Revenue — % paid customers, average revenue per customer, conversion rate (trial to paid), transactions, shopping cart abandonment, ad CTR.
- Retention — % users returning daily/monthly/yearly, churn rate, customer lifetime value.
- Referral — Net Promoter Score, viral coefficient.
Product Metrics 101
Product Metrics 101
A metric is anything that can be quantified and measured in a specific number, and hence be compared over time.
When we have a product, we want it to deliver value to users. Understanding user behaviour and how they use the product tells us if they are getting that value. We study this by mapping product value to specific metrics called Product Metrics.
Product metrics reveal details about how users are interacting and responding to your product. Tracking them can answer: which features are used most, how long they're used, what makes users stop using them.
Why use metrics?Without tracking metrics, your product team would miss meaningful insights into customers. Surveys and interviews provide a glimpse into customer perception, but behavioural data reveals trends and missed opportunities. Hard data removes emotional bias and ensures you're building features that appeal to users.
Can product value always be measured?Yes. No matter how intangible the value appears, you can apply quantitative measurements to any product. For example:
- A video streaming service → measure how many videos watched weekly, time spent on each.
- A meditation app → measure session completion rates, % of users returning weekly.
A helpful tool is defining value moments — user events or actions that indicate a person is getting value from your product.
- Dating app value moment → liking a photo or sending a message.
- Food delivery app value moment → placing an order.
- Therapy app value moment → taking a therapy session.
These value moments, once quantified, become your key performance indicators (KPIs).
Root Cause Analysis
Root Cause Analysis
Root cause analysis (RCA) is a problem-solving method used to identify the underlying causes of issues or faults in a product or product management process. The objective is to discover what caused a problem, why it happened, and how to prevent it from recurring.
Example: You're a PM at a fintech startup and you see that yesterday, the signup conversion for new users decreased. What do you do? Step-by-step RCA process:- Step 1 — Clearly define the problem statement.
- Step 2 — Collect and analyse data to understand the problem's nature and extent.
- Step 3 — Develop hypotheses of the underlying causes.
- Step 4 — Investigate and validate the root cause hypotheses.
- Step 5 — Brainstorm and prioritise solutions with the greatest impact.
First, verify data is being collected properly by matching numbers on the analytics tool with the database. Check there were no external factors. If data is flowing correctly and no external factors exist, move to hypothesis development.
Use the MECE framework: consider all possible scenarios and levers that can move the metric.
Example hypotheses for a signup conversion drop:- The conversion for one acquisition channel has gone down.
- A new app update caused it not to open properly.
- The backend server was down for some time.
- The drop is isolated to one screen in the signup flow.
- Users didn't receive OTP when trying to sign up.
Once hypotheses are established, go through the data to validate each one and find the root cause.